

Browser developer tools, often called DevTools, let you inspect a webpage’s current document, styles, network activity, script messages, and performance. They help connect what someone experienced with evidence about how the browser handled the page.
A button that appears unresponsive might be waiting for a request, blocked by a script error, covered by another element, or responding without useful feedback. The visible symptom does not identify the cause. DevTools helps narrow those possibilities, test an explanation, and check whether a correction addresses the original problem.
The important distinction is between what you observed and what that observation establishes. A successful response does not necessarily mean a record was saved. An error message does not necessarily explain the broken interaction. A fast test on one computer does not establish that a page is fast for everyone.
Begin with the symptom and preserve the conditions
Before changing settings or clearing data, describe the problem in terms another person could check. “The website is broken” leaves many possibilities open. “After selecting Save, the spinner remains visible and no confirmation appears” identifies an action and an observable result.
A useful starting record includes:
- The page and the action being attempted.
- The expected result and what appeared instead.
- The browser, approximate time, and relevant device or viewport conditions.
- Whether the person was signed in and whether the problem repeats.
- Any work that needs to be preserved before reloading or testing again.
Open DevTools through the browser’s menu or the page’s Inspect command. Panel names vary: Chromium-based browsers commonly use Elements, Firefox uses Inspector, and Safari provides its tools through Web Inspector. The underlying questions are similar even when the controls differ.
Start recording before reproducing the behavior. The Network panel generally cannot provide a complete request history from before it was opened, and a performance trace needs to cover the relevant action. Console history may also be lost during navigation unless its preservation setting is enabled.
Avoid immediately clearing cookies, storage, or caches. Those actions can remove useful evidence, end a session, or discard locally retained work. They may become appropriate tests later, but they change the conditions you are investigating.
Choose a tool for the question
DevTools is a collection of instruments rather than a single diagnostic report. Start with the panel that can answer your immediate question, then follow the evidence elsewhere if needed.
- Network
- Did the browser attempt a request? What response or error did it receive? Where did time pass?
- Elements or Inspector
- What is in the current document? Which styles apply? What occupies the space around a control?
- Console
- What errors, warnings, or application messages were recorded? In what execution context?
- Performance
- What activity occurred during loading or interaction? Was the main thread occupied, and by what work?
- Storage, Application, or accessibility tools
- What information is retained locally, or what names, roles, and states does the browser expose?
No panel tells the whole story. A request can complete while a script fails to update the interface. A control can look correct while exposing an unhelpful accessible name. Following a question across panels is often more useful than collecting everything at once.
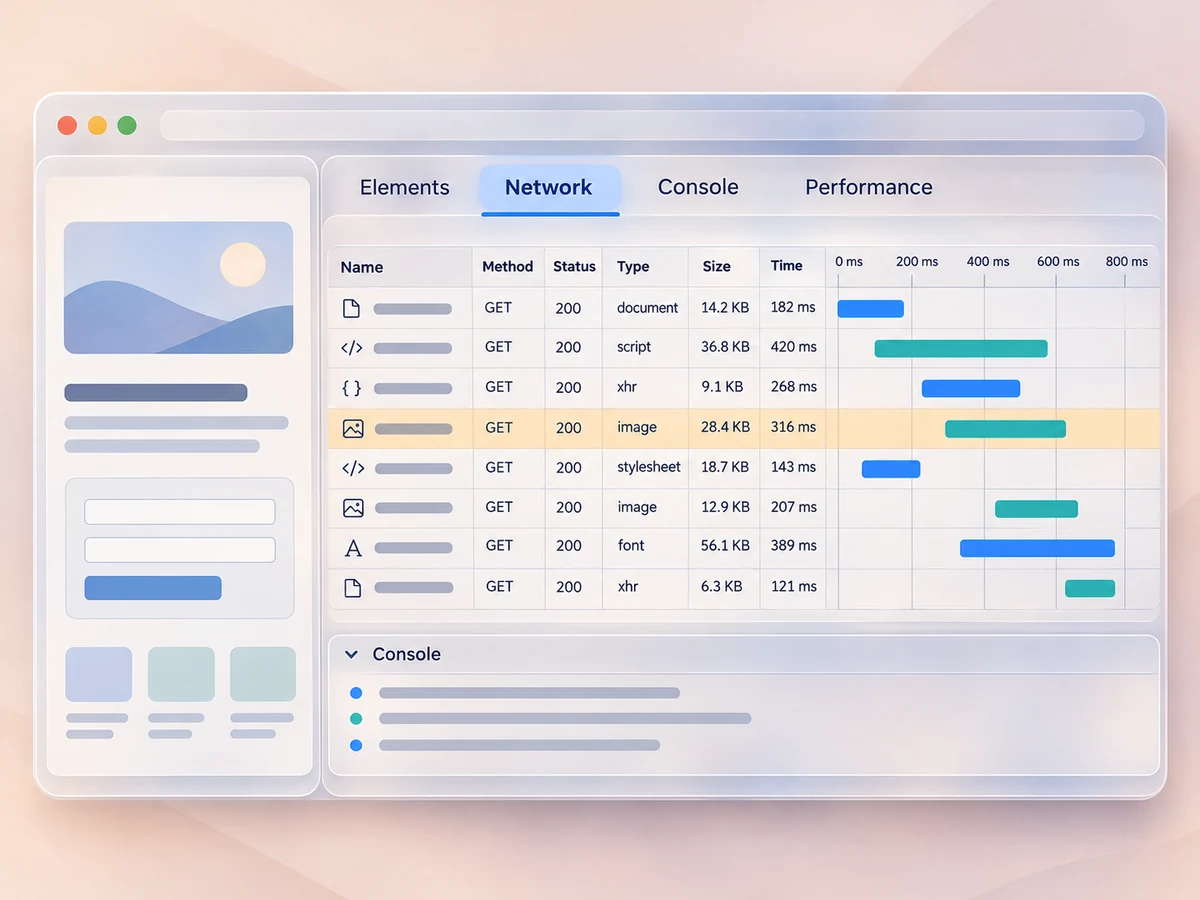
Network: requests, responses, and waiting
The Network panel records browser-observed request activity while recording is active. It can show document loads, images, stylesheets, scripts, API requests, redirects, and other exchanges. Filters help isolate the requests associated with one interaction.
Inspect the exchange, not only its status
For a relevant request, examine the URL, method, status, request data, response content, initiator, and timing. Together, these help distinguish several different situations:
- No matching request was recorded during the action.
- A request was attempted but encountered a network or browser-policy error.
- The server returned an HTTP error response.
- The server returned a successful HTTP status but reported an application-level problem.
- The response contained the expected result, but the interface did not present it correctly.
These findings lead to different investigations. A 200 response might contain an application error or an unexpected login page. A 202 response can indicate acceptance for processing rather than completed work. Understanding HTTP requests and responses helps keep transport evidence separate from the task’s outcome.
If no request appears, first check that recording was active and filters are not hiding it. Some actions are intentionally local. An absent request is not, by itself, proof that a click handler failed.
Account for caching and service workers
A resource may be reused from a browser cache or supplied through a service worker rather than fetched through an ordinary network exchange. Check the delivery information available in the panel before assuming the browser received a fresh copy from the server.
Disabling the browser cache can help compare behavior, but it changes the test. It does not necessarily bypass a service worker’s cache, a content delivery network, or server-side caching. Record what you changed and compare it with the original conditions. URLMD’s explanation of browser caching provides the underlying distinctions.
Read timing as browser-side evidence
A request waterfall can reveal sequencing, overlap, and waiting. Depending on the request, timing details may include queueing, connection setup, waiting for a response, and content download.
A long wait before response data arrives does not isolate server execution time. Network conditions, intermediaries, and backend work may all contribute. Browser timing identifies where to investigate next; server logs or tracing may be needed to explain the remote portion.
Elements and Inspector: the current document and styles
The Elements or Inspector panel shows the current Document Object Model, or DOM. That is not necessarily identical to the HTML originally delivered. The browser parses the source, and scripts can add, remove, or modify content afterward.
This distinction matters when a control is missing, a message never appears, or the page differs from its source markup. Inspecting the current document helps determine what exists at the moment of the problem.
Separate missing content from hidden content
If a confirmation is not visible, ask whether its element exists. If it does, inspect the styles and layout affecting it. It might be hidden, clipped, positioned outside the visible area, or covered by another element.
The styles view shows matching rules and declarations that have been overridden. The computed-style view helps identify the resulting values after the cascade. Layout and box-model tools can clarify dimensions, spacing, and positioning. These are related views, not interchangeable ones; the CSSOM and computed styles explains that relationship in more detail.
Temporarily disabling a declaration is a useful experiment. If removing an overlay makes a button operable, that supports an explanation involving the overlay. It does not establish why the overlay remained or whether removing it is a safe production fix.
Treat local edits as experiments
Changing text, attributes, or styles in DevTools usually changes only the inspected page in your browser. It does not update the website’s source or deploy a correction. Local override and workspace features can retain certain changes, but those still require a deliberate implementation and publishing process.
Where accessibility information is available, inspect a control’s computed name, role, and state as well as its appearance. Then test the interaction itself. An accessibility view can reveal structural problems, but it does not replace testing with assistive technology or checking keyboard operation.
Console: messages, errors, and execution context
The Console displays messages from browser subsystems and application code. It can reveal uncaught exceptions, failed resource loads, policy restrictions, warnings, and deliberately logged diagnostic information.
Start with messages that appear when the relevant action occurs. Check their timestamps, source locations, and stack traces where available. An exception in the code handling a save response is more directly relevant to a missing confirmation than an unrelated warning from an advertising script.
Even a relevant error needs interpretation:
- An error may be a consequence of an earlier failure rather than the original cause.
- A stack trace may reference bundled or minified code; source maps can help when available.
- Messages may come from an embedded frame or extension rather than the main page.
- A quiet Console does not establish that the application worked correctly.
The Console also executes code. A command can inspect state, but it can also alter the page, change stored information, or initiate requests using the current session. Do not paste unfamiliar code into it. If an investigation requires a command, understand its purpose and possible effects before running it.
When a page contains multiple frames or other execution contexts, confirm which context the Console is inspecting. A correct observation made in the wrong context can produce a misleading explanation.
Performance: activity over time
A performance recording captures a timeline of browser activity over a selected interval. Depending on the browser and recording settings, it can include script execution, style calculation, layout, paint activity, network events, and screenshots.
Use a short recording around a specific question: why did this menu respond late, why did the layout move, or what happened while the page appeared frozen?
For an unresponsive interaction, look for work occupying the main thread near the action. Long-running JavaScript can delay event handling and rendering updates even when no network request is pending. Conversely, an interface may be waiting on a response while the main thread has little work to do. The distinction is explained further in JavaScript execution and the main thread.
A trace can locate expensive activity without automatically explaining its cause. Repeated layout work, for example, deserves inspection of the code and conditions that triggered it. A large block of script execution may include necessary work as well as avoidable work.
Keep test conditions visible. Recording adds overhead, emulated throttling is an approximation, and a docked DevTools window can change the page’s viewport. A local trace is valuable diagnostic evidence, not a measurement of every visitor’s experience. Interpreting Lighthouse scores and Core Web Vitals requires similar attention to measurement scope.
Follow one interaction across the tools
Consider a hypothetical editing page where Save leaves a spinner visible. The investigation should preserve the draft and avoid repeatedly submitting until the result of the first attempt is understood.
- Capture one controlled attempt. Open Network and Console, confirm recording, note the time, and select Save once.
- Inspect the request. A matching request appears. Its response reports a saved record and a new revision identifier. That is evidence of the application’s reported result, not yet an independent check of persistence.
- Check the Console. An exception appears in code that processes the response. The source location suggests the interface failed while handling the result.
- Inspect the current document. The spinner remains, and the expected confirmation has not been inserted. This is consistent with interrupted response handling.
- Verify the saved record separately. Without discarding the draft, use an appropriate read-only view or authorized record check to confirm whether the expected revision exists.
If that check confirms the saved revision, the supported finding is narrower and more useful than “Save failed”: the record was saved, but the interface failed to complete its feedback. The correction belongs in the response-handling path, while the interface also needs to avoid encouraging unnecessary retries.
A different response could lead elsewhere. An authorization error might require session investigation. No recorded request might lead to event handling or validation. The sequence follows the evidence rather than forcing every spinner into the same diagnosis.
This is why HTTP success, interface success, and task success need separate checks.
Verify the correction and share evidence safely
After a change, repeat the original action under comparable conditions. Check the intended outcome, not merely the disappearance of an error message. If a temporary CSS edit helped, implement the correction in the maintained source and test that version. If a script change restores confirmation, also check relevant failure and recovery paths.
Where practical, change one variable at a time. Clearing storage, updating code, disabling extensions, and changing networks together might make the symptom disappear, but it leaves the explanation uncertain.
State what the test establishes
A useful investigation note separates:
- Observation: What happened in the recorded session.
- Explanation: What the evidence supports, including remaining uncertainty.
- Change: What was modified.
- Verification: Which behavior was retested and what happened.
- Scope: Which browsers, accounts, devices, or conditions were checked.
One browser session cannot establish that every browser behaves the same way, that a backend record is durable, or that all users have received a deployment. Device emulation does not reproduce an entire physical device. Browser evidence may need to be connected with server records, deployment information, field measurements, or testing in other environments.
Protect the information inside diagnostic files
Network exports, screenshots, response bodies, Console logs, and copied requests can contain credentials, personal information, document contents, or internal system details. A copied request may include enough session information to act as the signed-in user.
Collect only what is needed, inspect it before sharing, and use an approved channel. Do not assume an export is safe because a tool offers a sanitization option. Check the remaining URLs, headers, payloads, and response content. Replaying a request can also repeat a real action, so it should not be treated as a harmless inspection step.
DevTools is most useful when each observation answers a specific question. Preserve the conditions, inspect the relevant activity, test the explanation, and report the limits alongside the result. That produces a diagnosis another person can evaluate—and a correction that can be checked against the problem people actually encountered.
The Browsers and Rendering Neighborhood connects these investigations with the underlying work of requests, parsing, rendering, scripting, storage, and accessible output.